Exhibition DataBlick : Where Data Meets Art
1
2
3
4
5
6
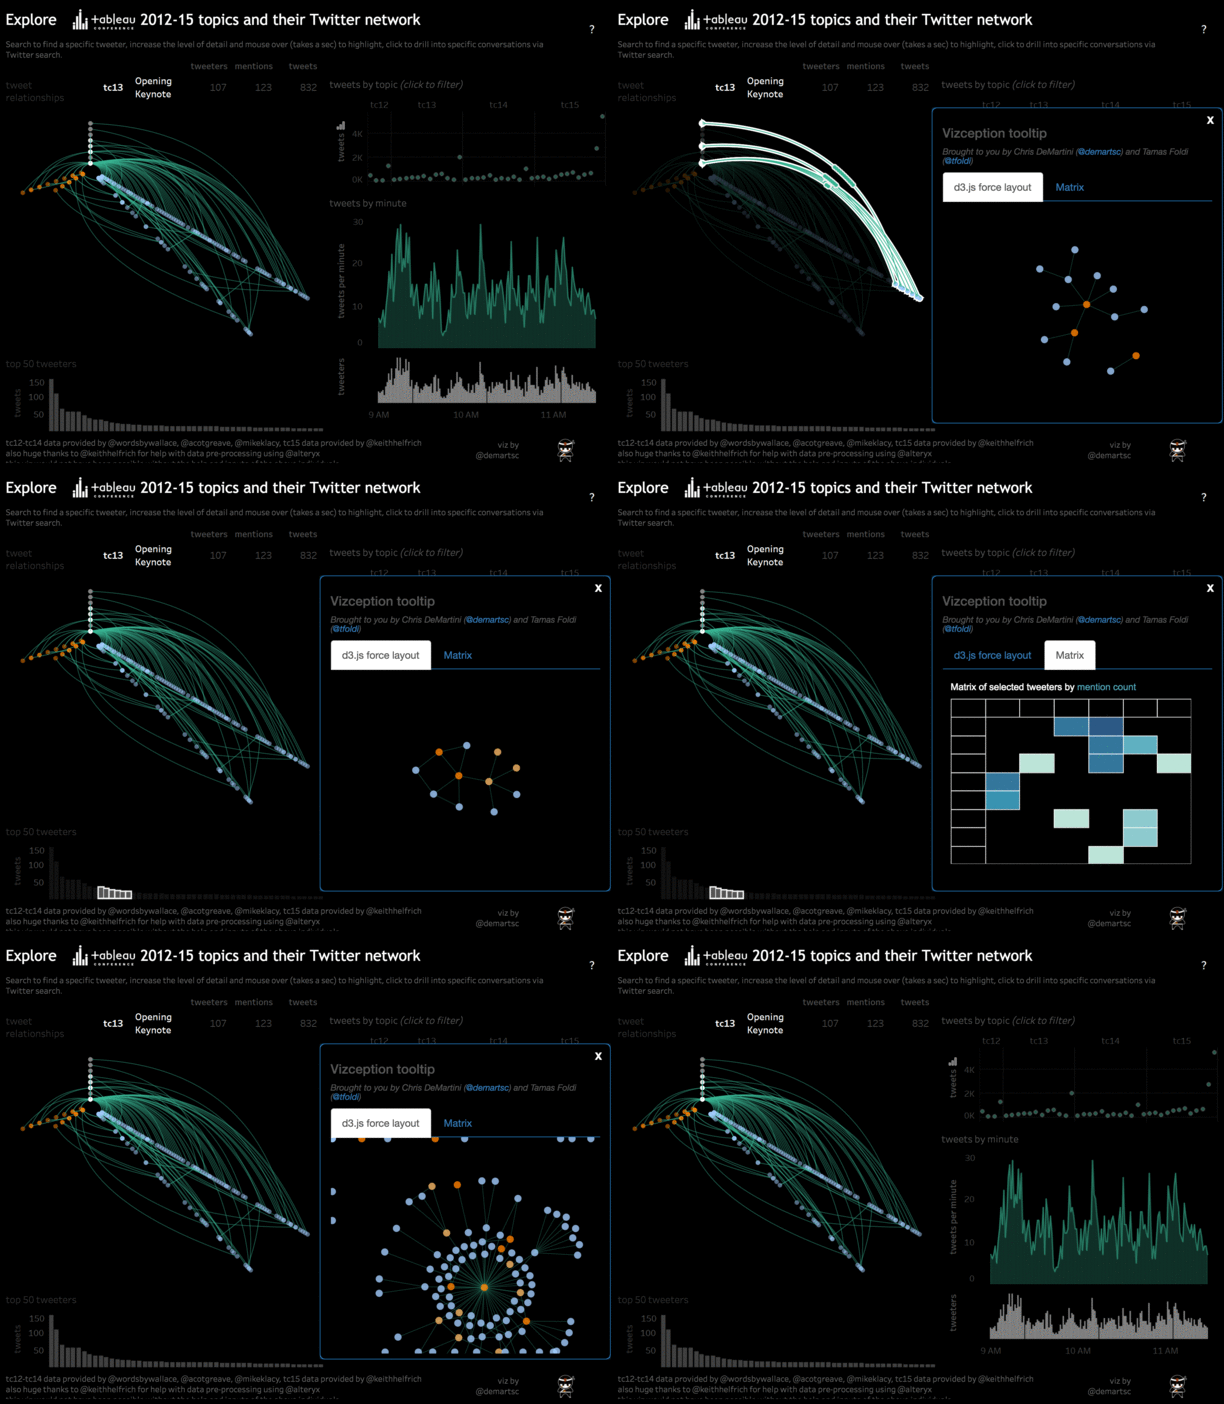
Vizception: Viz in a viz & native d3.js integration on Tableau Server
We wanted to show a real example of how to bring more to Tableau Server without additional hardware or hosting needed. That’s right, no additional server purchase requisition requests needed. There are really too many use cases to count when it comes to this, the details herein are only the tip of the iceberg.
We had a few short discussions and landed on the following example. This includes not only native d3.js integration but also an example of viz in a viz (in a viz) on Tableau Server. As a starting point, we used the twitter network graphs that Keith Helfrich and I recently shared, which were showcased on the Tableau blog last month.
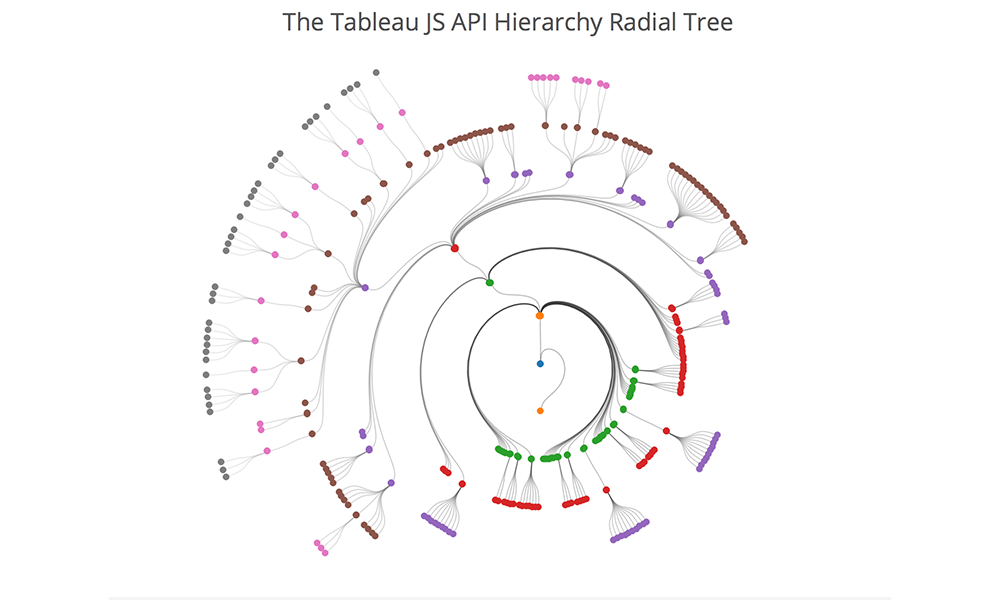
The Tableau JS API Hierarchy Radial Tree
This is an incremental post to navigating your family tree from a few months back. This builds off of that visualization technique to manipulate the tree into a radial view. Also, as with the original, the tree is 100% dynamic and you can reset each node in the tree as the root node, toggle between tree views as well as change the API you are analyzing.
What is the benefit of a radial tree? As your data volume and hierarchy levels increase, you will ultimately run out of space on your screen with a traditional hierarchy. That is where the radial tree can add value. With the root node as the center of the viz, and each level of the hierarchy increasing in diameter, you ultimately have more viz real estate to work with as you dig deeper into your hierarchy.
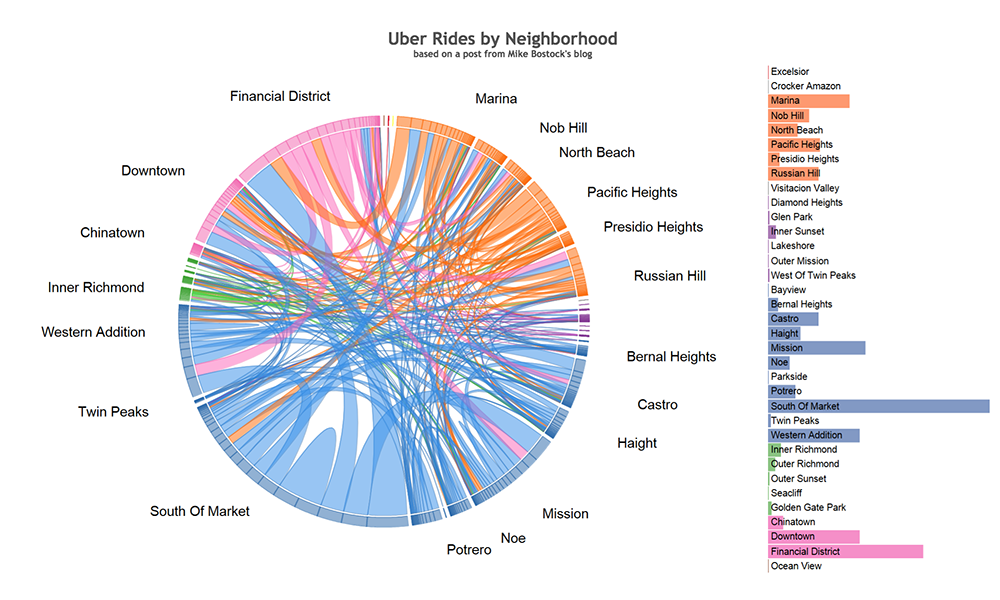
Chord Diagrams in Tableau
Can I make this in Tableau?… You can now.
Chord Diagrams are a chart that is often used for visualizing network flows that represent migration within a system, the one on the left for example, shows changes in cell phone choice for a collection of users. I’ll introduce the chart type a bit more carefully later, and provide a reference, but by the end of this post my hope is that you’ll have a sense of how you might build this type of chart with your own data in Tableau.
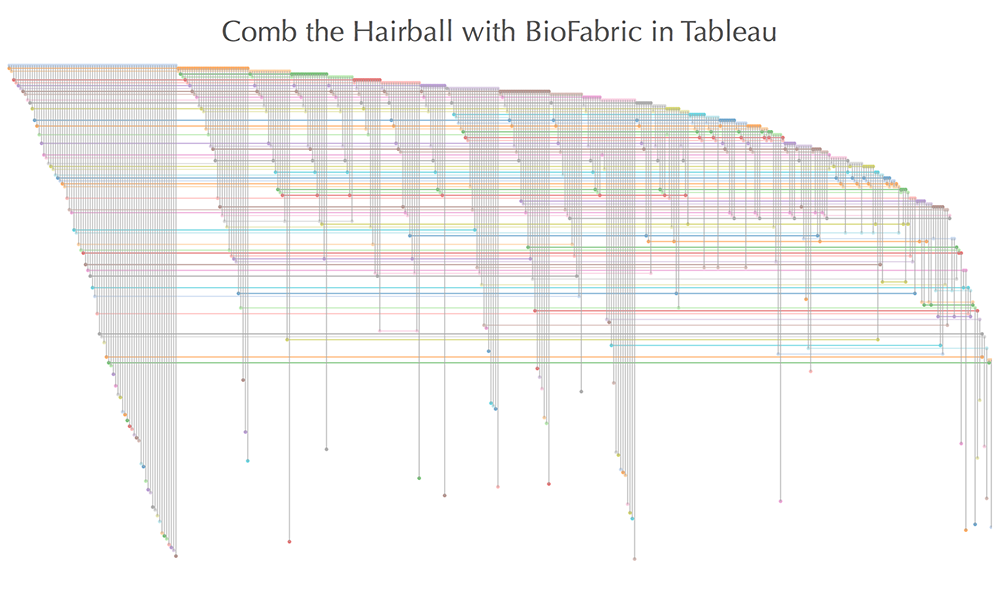
Comb the Hairball with BioFabric in Tableau
Recently I posted about creating circular and hive plot network diagrams using Tableau and a question was posted around whether we could also execute theBioFabric network graph within Tableau. There is a lot of additional information about the BioFabric network graph at their website. The super-quick demo is a good intro to the graph if you have not seen it before.
The answer to the question posted is yes and this post is designed to walk you through the steps needed to build your own BioFabric graph within Tableau.
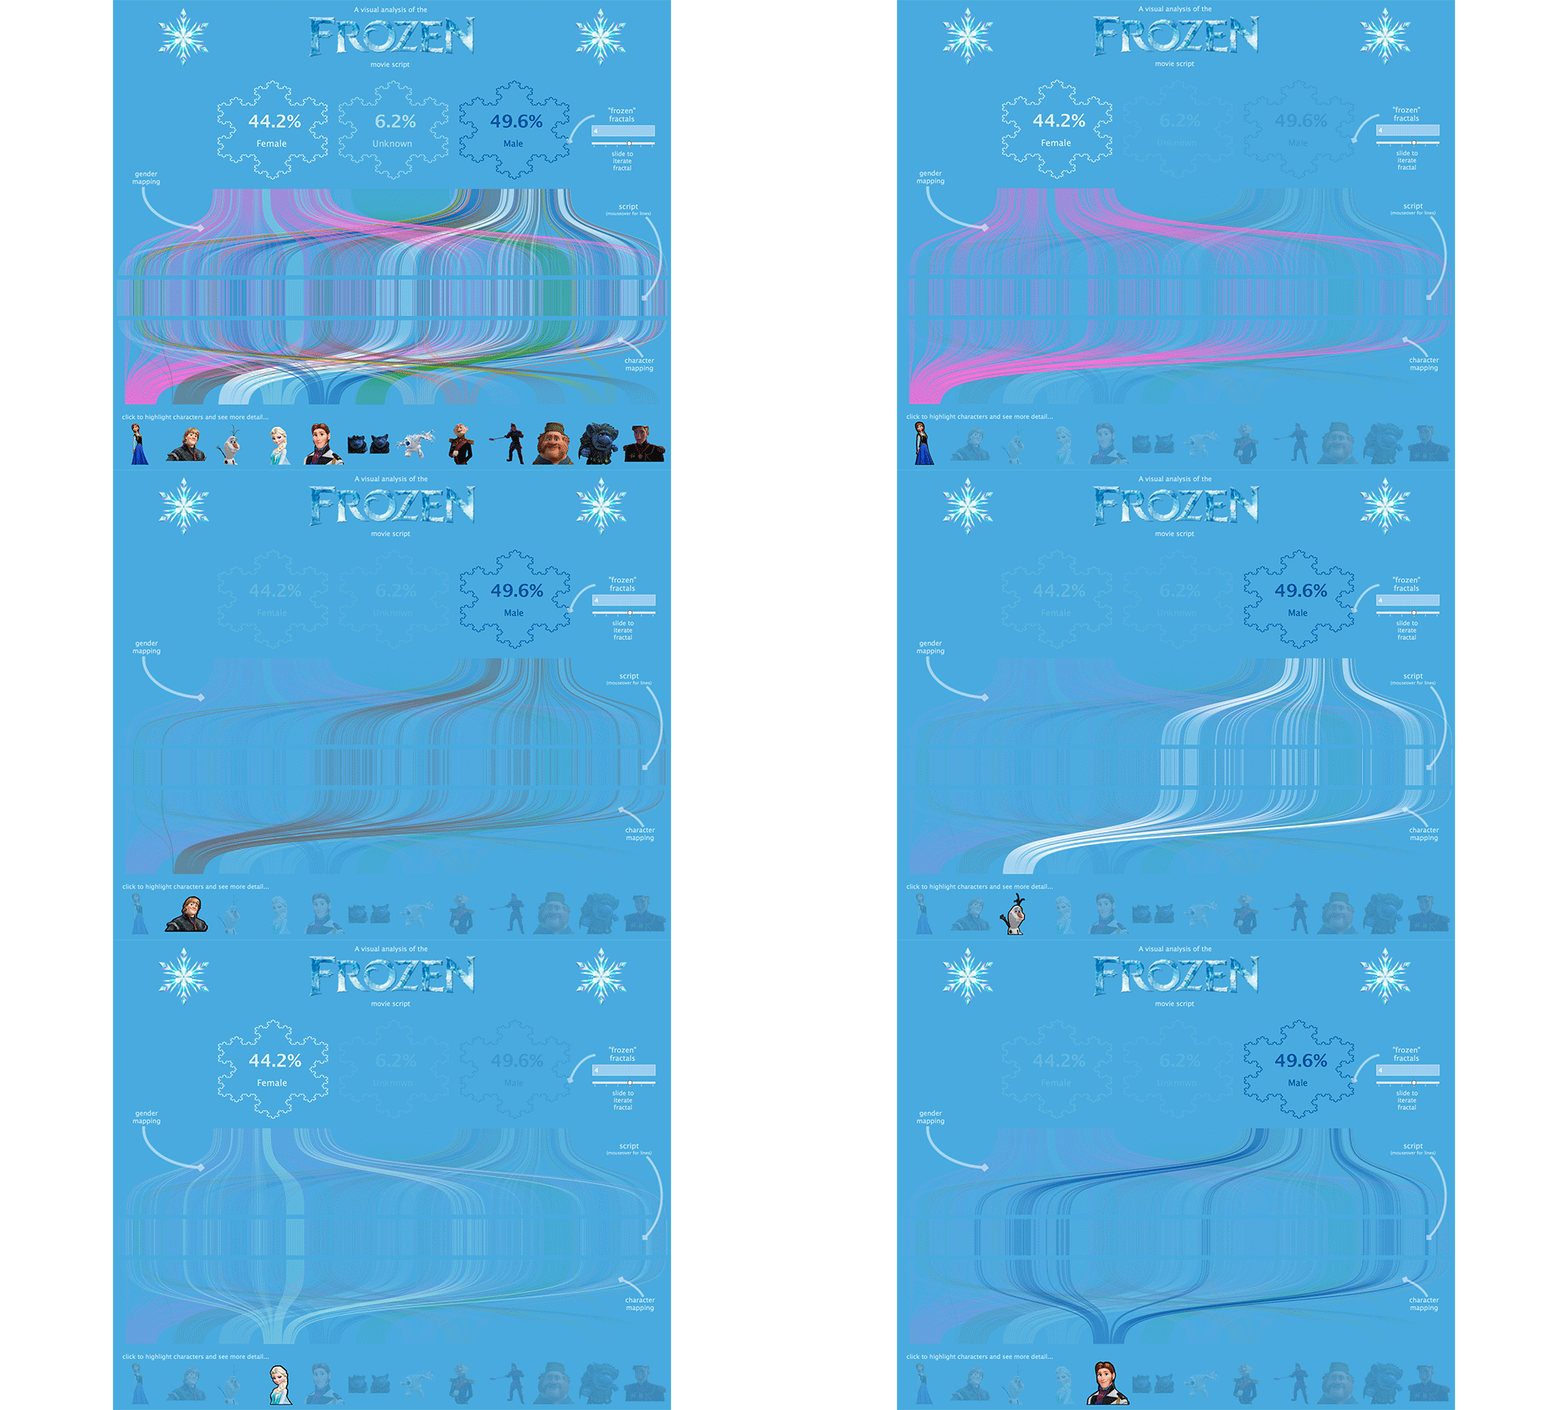
A Visual Analysis of the Frozen Movie Script
Use this beautiful Frozen Viz to analyze character interactions by Gender. Your 4 year old never loved Data Viz this much!
Navigating your Family History in Tableau
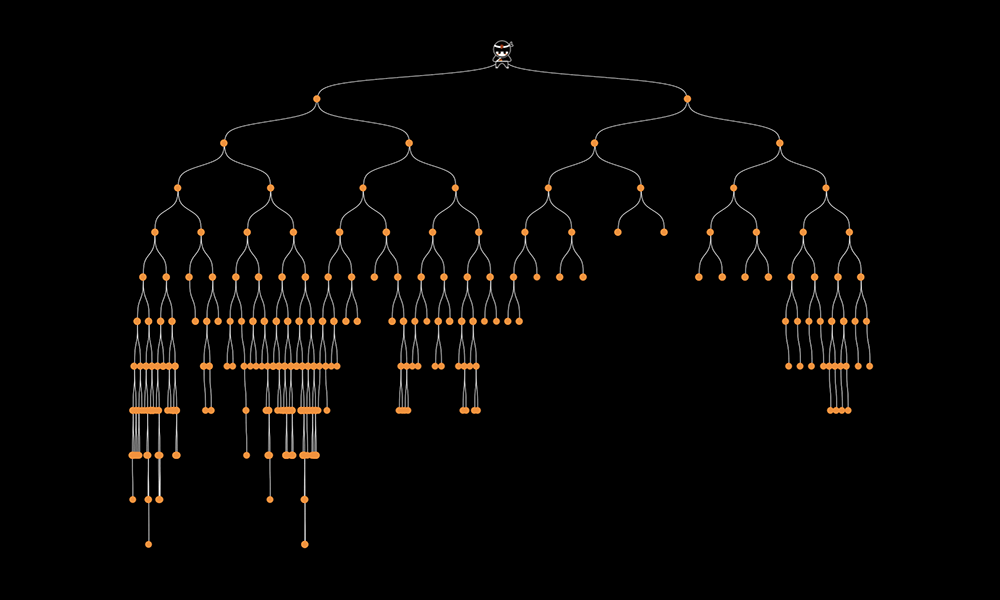
The Viz
We are going to build two tree views in Tableau, an ancestor view and a descendant view of a dynamically selected root person. Within this post I will walk through building the ancestor tree (a binary tree), feel free to reach out if you want more information on how the descendant tree was built, but will leave that to the imagination for now.