Exhibition DataBlick : Where Data Meets Art
1
2


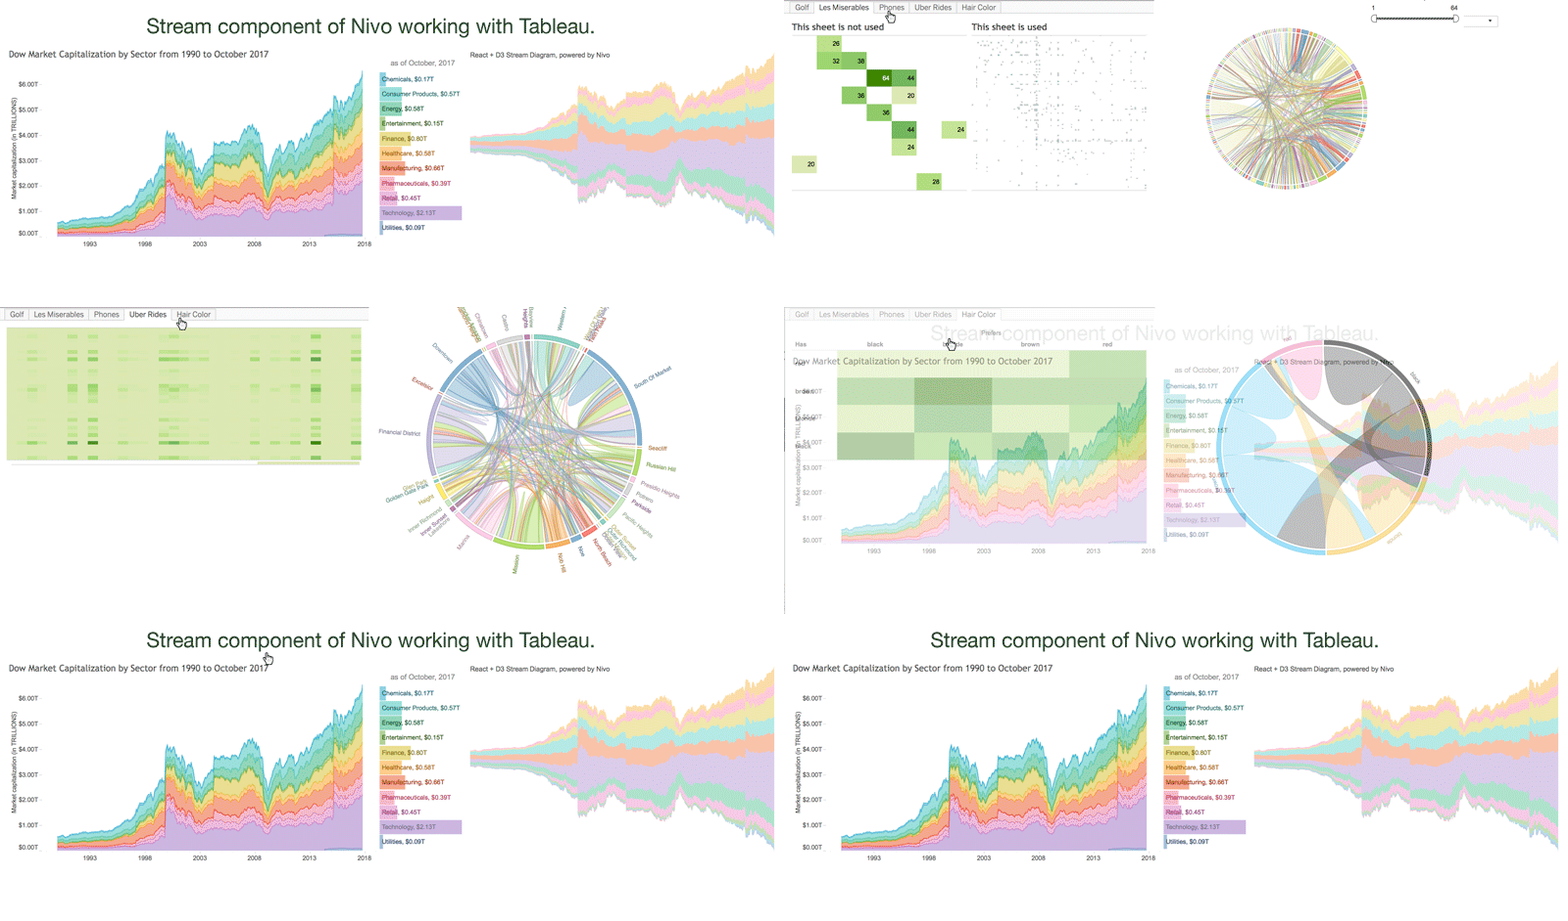
Easy as Pie React + D3 Chord Diagrams in Tableau
A functional example of Tableau integration with Nivo (React + D3)
We are going to be integrating with and leveraging Nivo, which is self described by Raphaël Benitte (it's creator) as “supercharged React components to easily build dataviz apps, it's built on top of d3.” Nivo is one of many react component libraries that work on top of D3, each are different and bring their own features and focus to their projects…
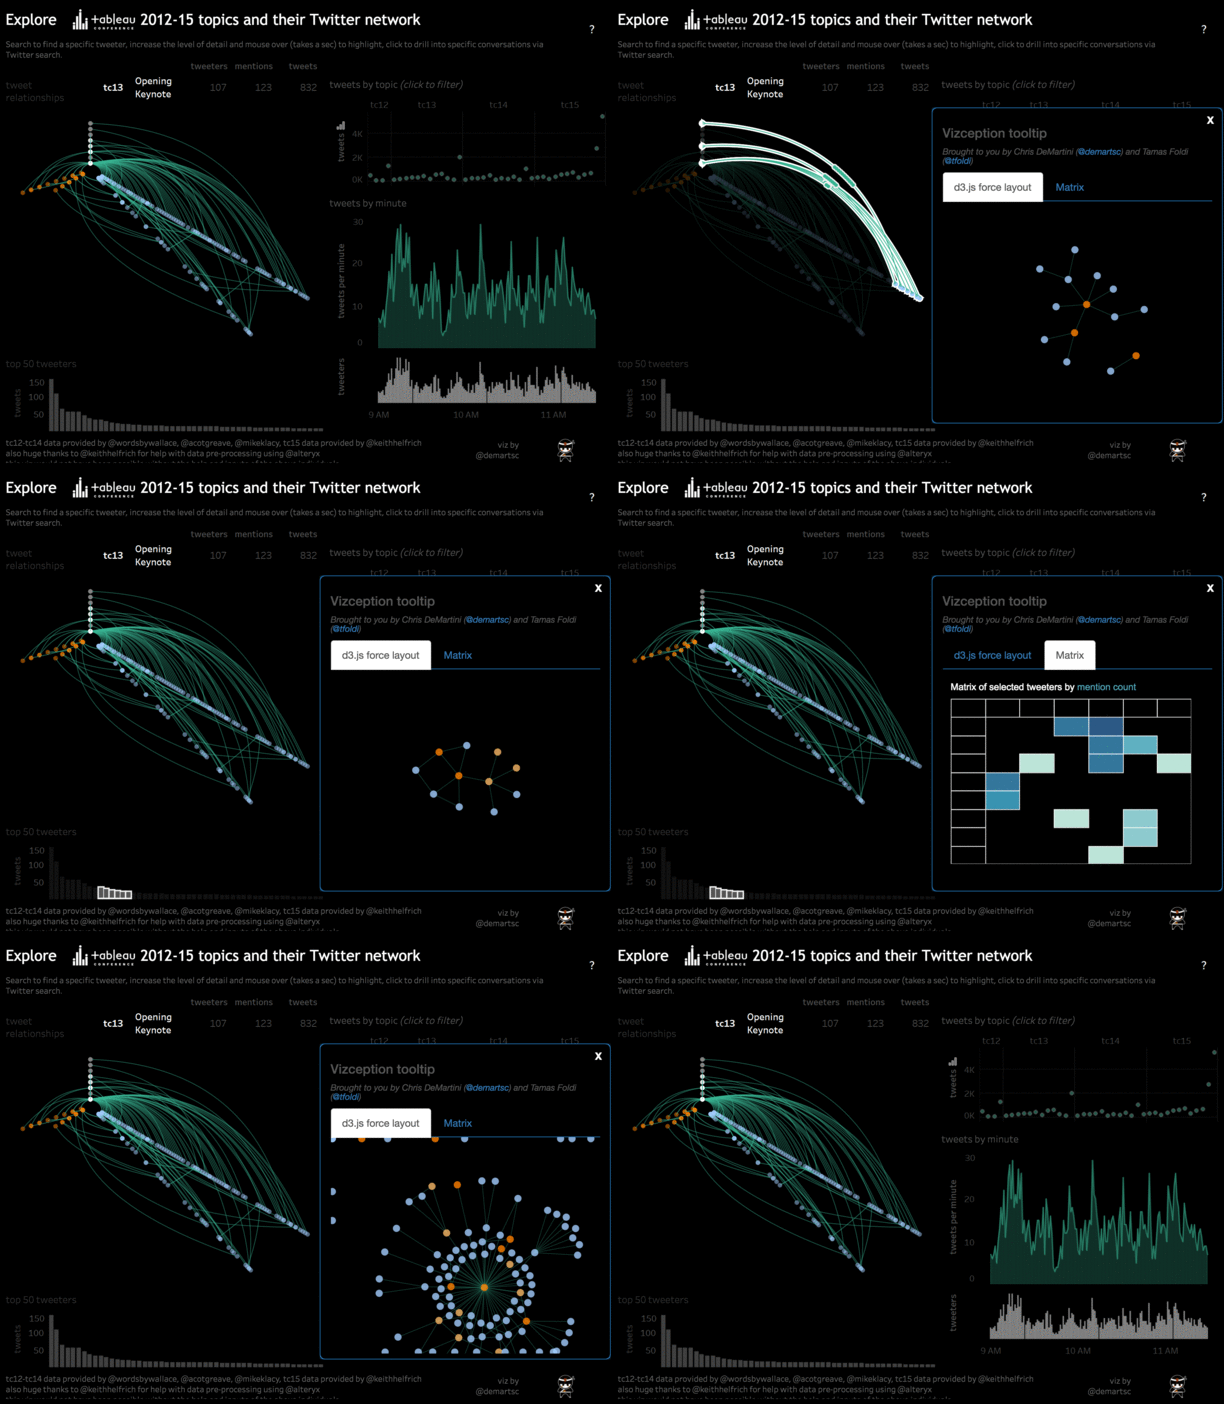
Vizception: Viz in a viz & native d3.js integration on Tableau Server
We wanted to show a real example of how to bring more to Tableau Server without additional hardware or hosting needed. That’s right, no additional server purchase requisition requests needed. There are really too many use cases to count when it comes to this, the details herein are only the tip of the iceberg.
We had a few short discussions and landed on the following example. This includes not only native d3.js integration but also an example of viz in a viz (in a viz) on Tableau Server. As a starting point, we used the twitter network graphs that Keith Helfrich and I recently shared, which were showcased on the Tableau blog last month.