Exhibition DataBlick : Where Data Meets Art
1
2
3
4
5
6
7
8
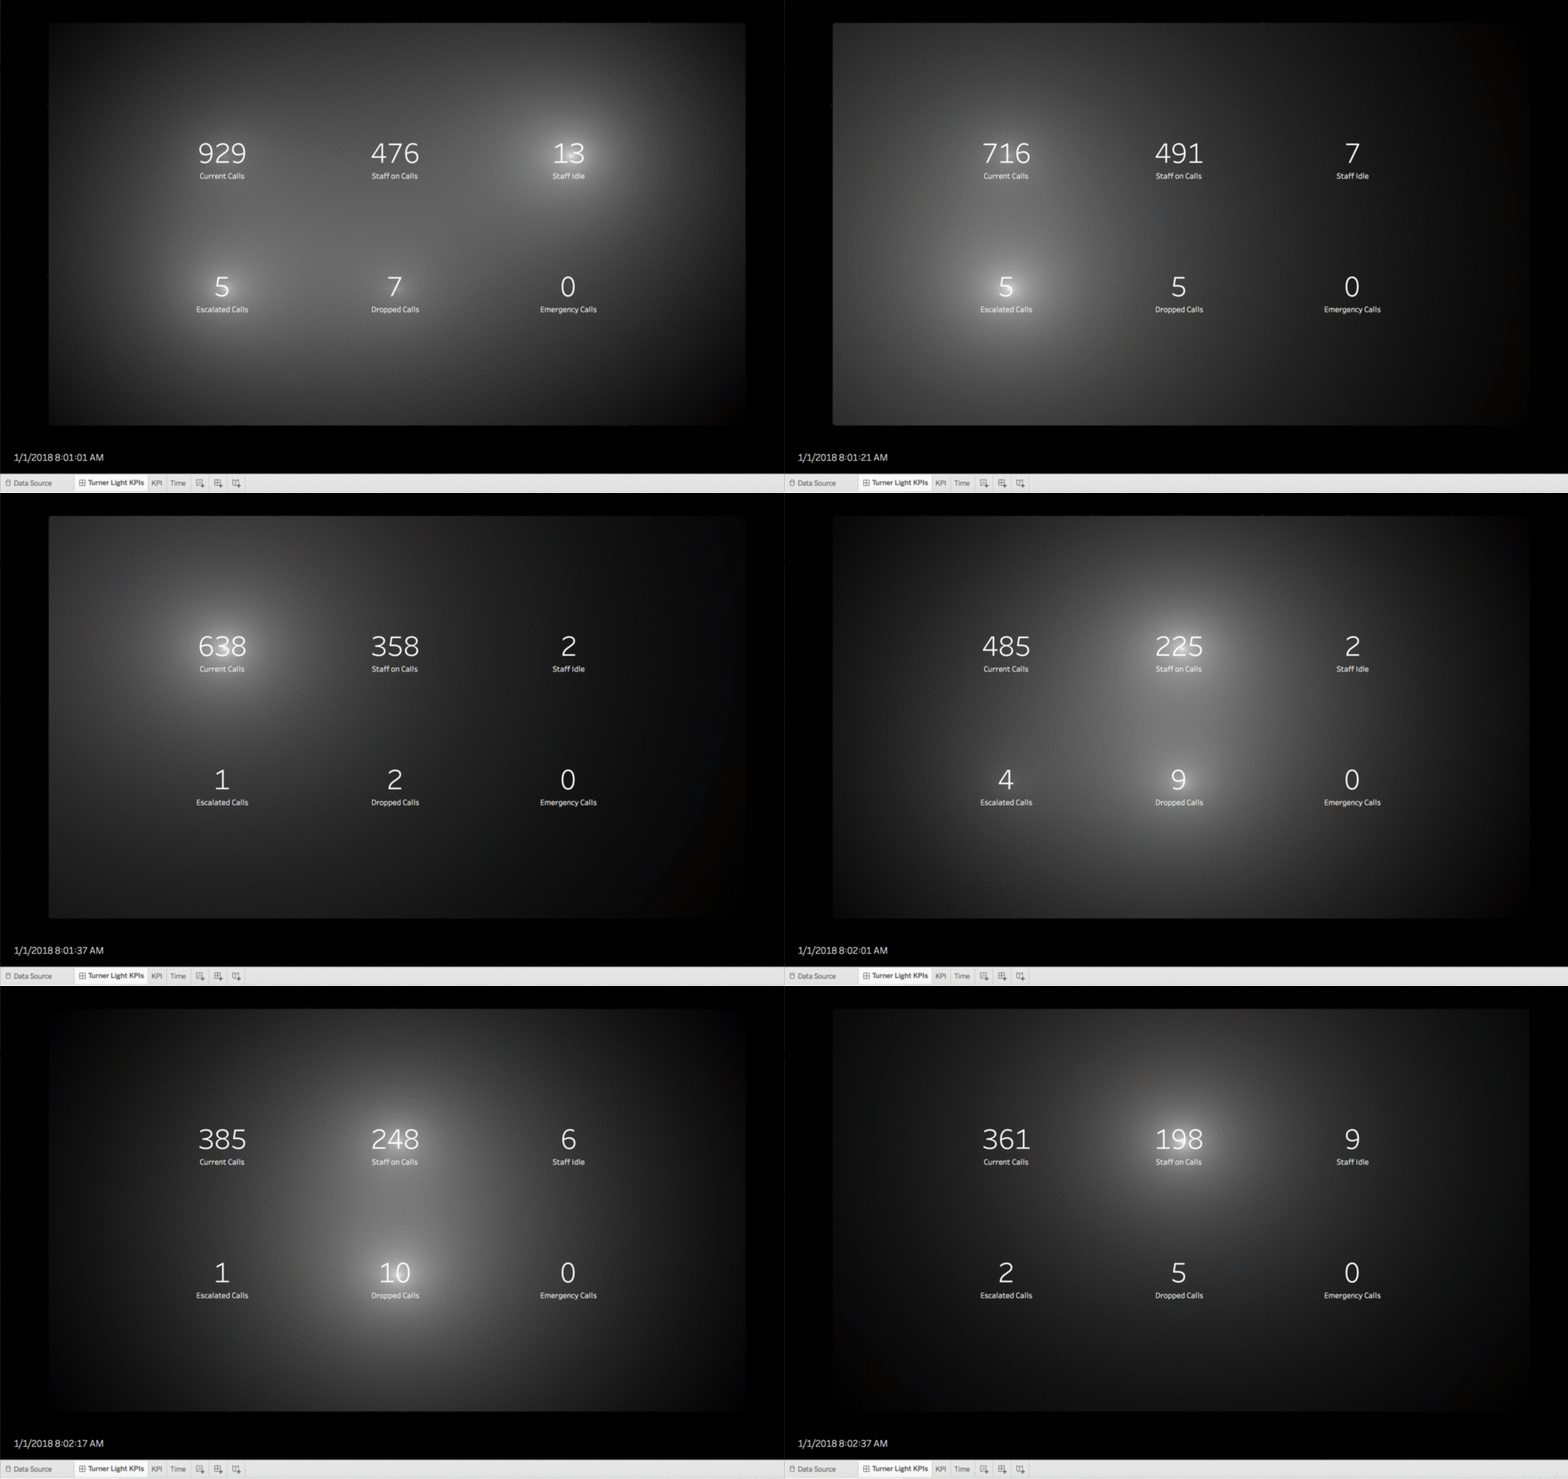

Lighting as an Attentive Attribute in KPI Dashboards
About 3 years ago, I saw an exhibit at the deYoung of J. M. W. Turner. It was a painting, “Slavers Throwing Overboard the Dead and Dying, Typhon coming on.”
I have been mulling over his technique of using broadly applied atmospheric washes of paint to draw focus and create intensity, and how to apply it to data visualization. We usually use the attentive attributes of color, size, shape, position, etc. to draw focus in dashboards.
I have been spending a lot of time pondering the UX of things not related to data viz and asking how to apply those design ideas to visualization work, as with my Widget post. Outside the sphere of data viz, in everything from photography, to video games, and interior design, lighting is a powerful way to draw focus and create emotion. I wanted a Marks card with a "Lighting" shelf.
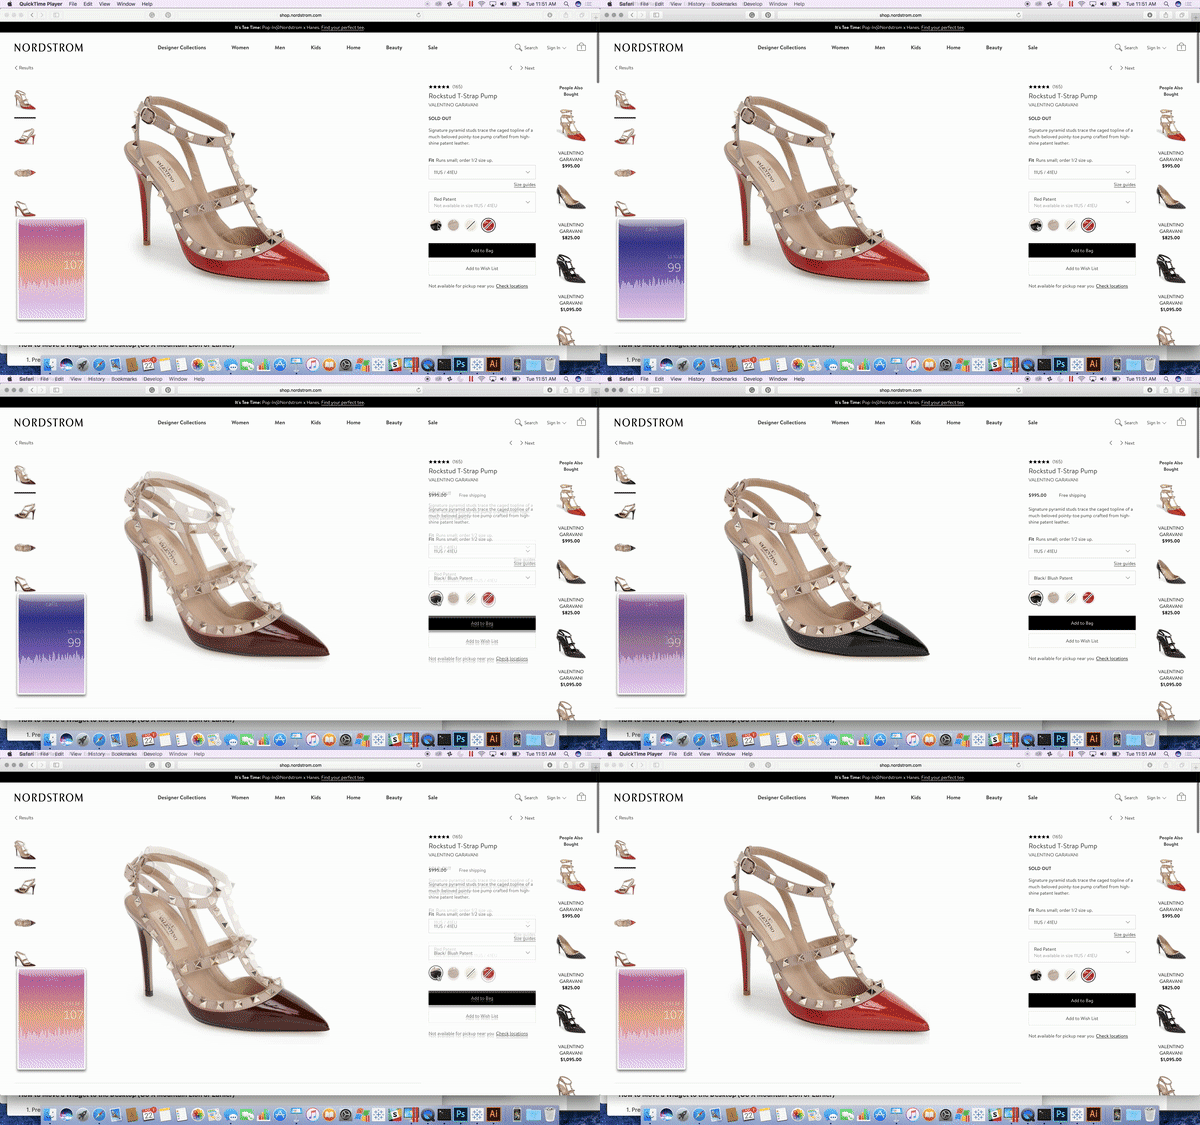
Tableau Ambient Widgets - the tiny, moody, & relevant data experience!
See that in the lower left corner? That would be a live updating Tableau Dashboard as a desktop widget on my Mac. I can keep an eye on things while getting important work done. :-).
Why did I make this? After school and work my kids and I talk about our day. Sometimes feeling particularly proud of myself, I will show off some dashboard that I have been working on, only to get a "meh" from my kids. Annoyed with the tween eye-roll, I asked Max what he thought was a cool dashboard? He fired up Star Wars Battlefront, and then Halo 5 on his Xbox to show me how the "youngs" think data should be consumed. While in the process of battling the "Dark Side", Max kept a constant eye scan on the little floating widgets which let him know key things such as the weapon he was using, the position of his team & the opposing team, his health level, etc.
This got me to thinking about the standard user experience of getting to a dashboard.
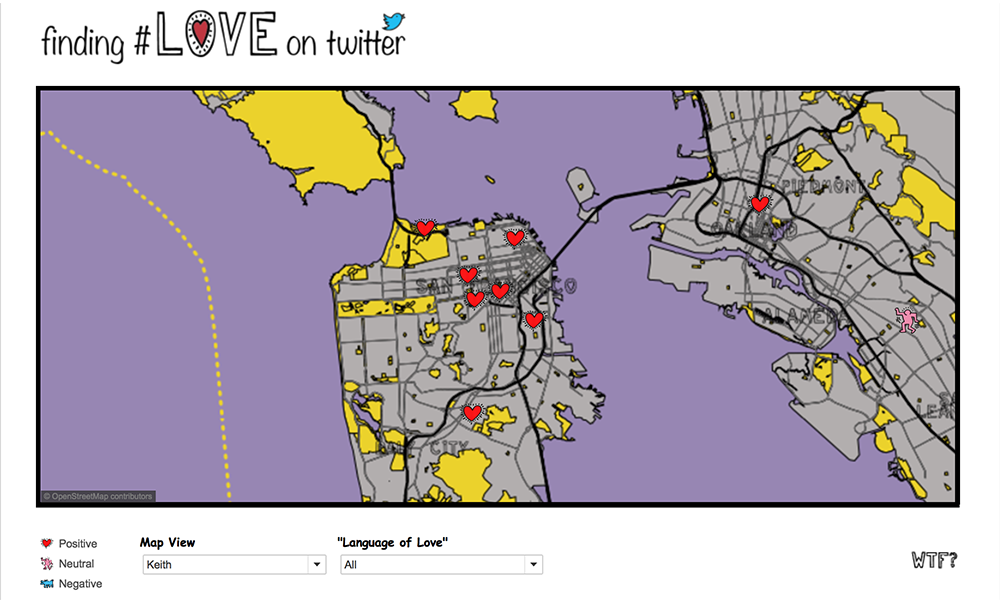
Finding #Love on Twitter
The final viz, “Finding Love on Twitter” was created as an excuse to showcase how multiple map layers created in Mapbox for use in Tableau, and the ability to toggle them on and off.
This adds onto the lessons on Mapbox customization for Tableau by showing you how to:
- Import custom shapefiles
- Edit them in QGIS (optional)
- Style them in Mapbox
- Add them to a Tableau .tms so you can toggle them on and off in many combinations to help your visual analysis.
Twitter TV Set
This was a fun visualization to analyze twitter data on current “hot topics”. A nod to Shel Silverstein’s “Jimmy Jet and His TV Set”, this Viz focuses on the obsession of Twitter and how the tweet has become more the news than the news itself.
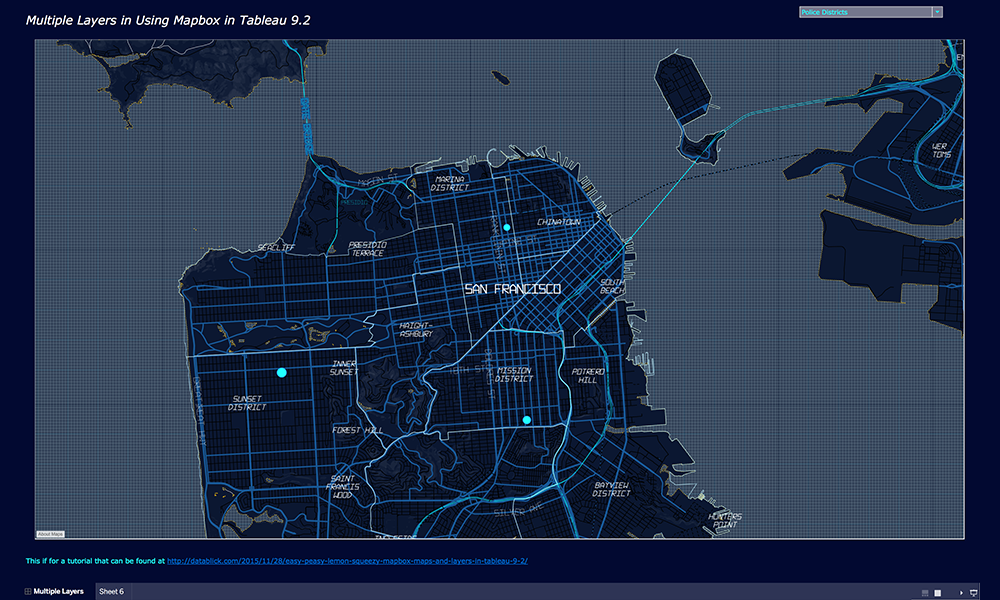
Multiple Mapbox Layers in Tableau 9.2
Learn how to add multiple Mapbox layers using the new UI in Tableau 9.2 and create a Parameter to swap out map view.
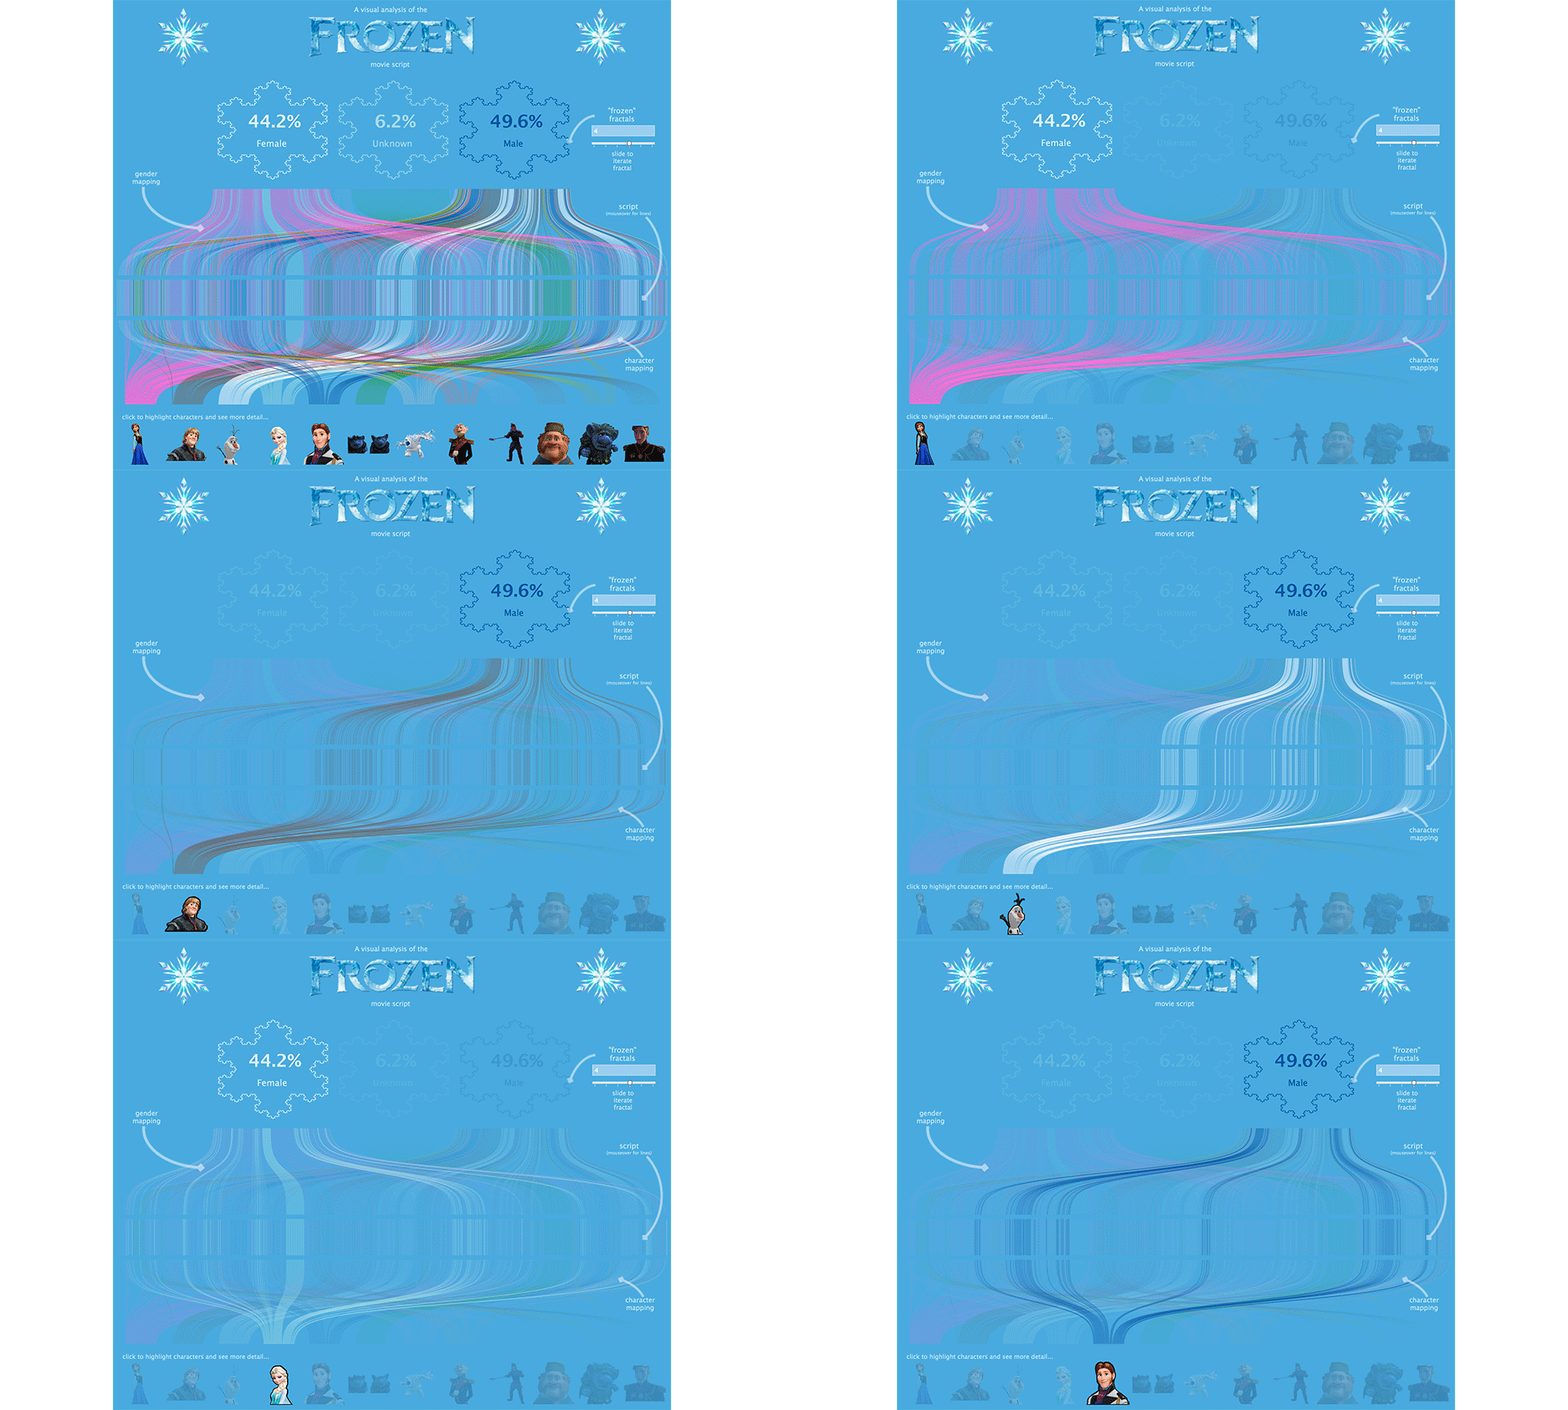
A Visual Analysis of the Frozen Movie Script
Use this beautiful Frozen Viz to analyze character interactions by Gender. Your 4 year old never loved Data Viz this much!
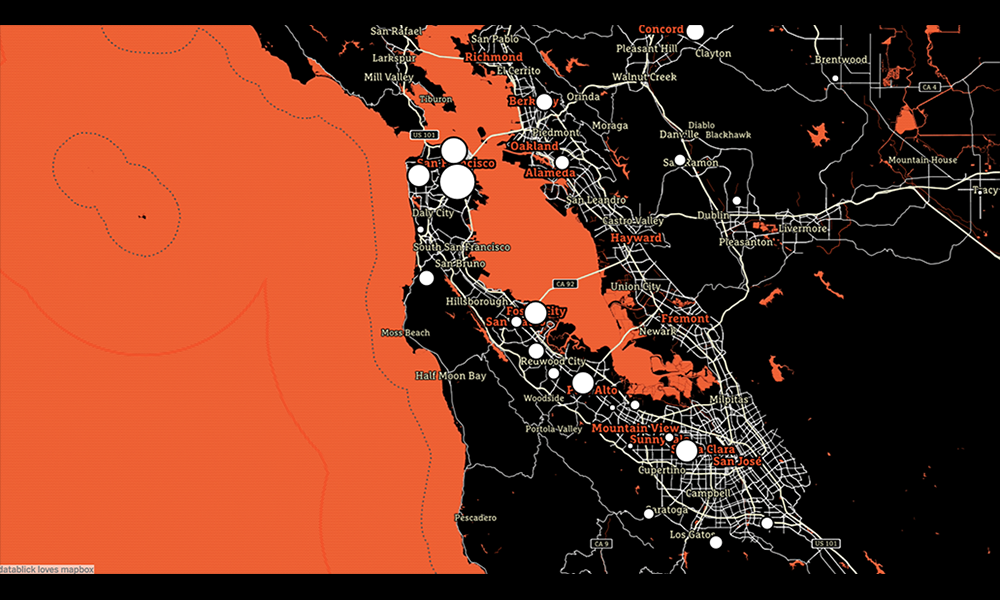
Fast and Fabulous Custom Maps using Mapbox in Tableau
So the last time I wanted a custom map, I ended up building my own WMS and spending months and $’s to get the map I wanted. Then one day recently, I had a cocktail with Allan Walker (that insane mapping Zen dude) who pointed out that if you just opened up a .tms file in notepad, there just wasn’t all that much to it but a wee bit of xml.
What follows is another DataBlick tutorial on making custom maps in Mapbox.
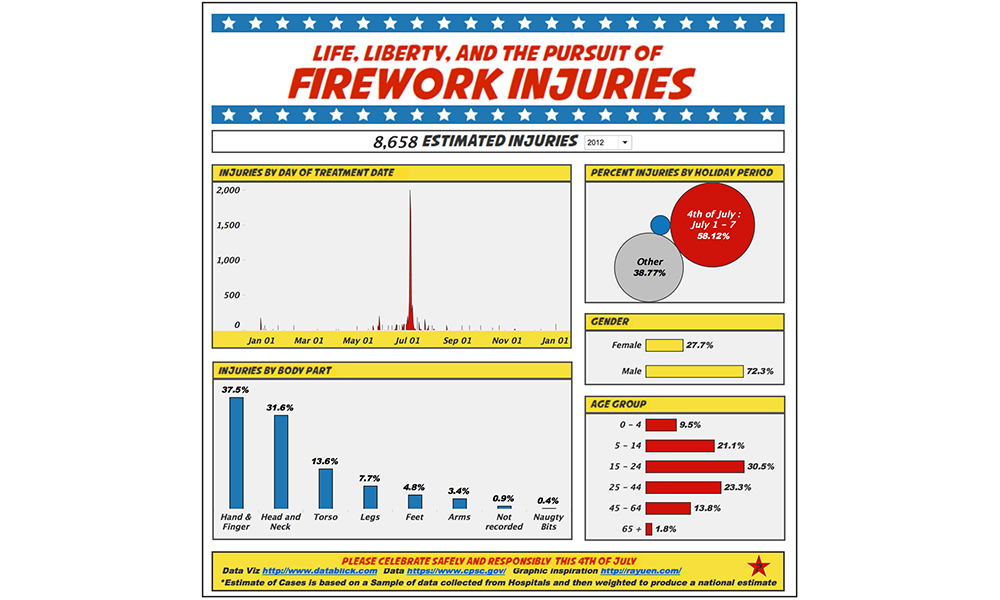
Firework Injuries
Using data from the Consumer Product Safety Commission, this visualization highlights all the injuries due to fireworks that happen, highlighting the 4th of July holiday period. Click on any category to filter on it, and explore what injuries occur across dates, genders, and age groups. Males seem to be more likely to get injured overall, and their injuries are to their hands and fingers. Females are more prone to head and neck injuries. Sadly, wee ones are almost 10% of injuries, mostly over the 4th of July week. Hover over any category and you can drill through to the gory details of the injuries (even the naughty bits).
Please be safe this 4th of July and enjoy fireworks responsibly.
Special thanks to Ray Yuen http://rayuen.com/ (of Pokemon fame!) for the comic book graphics inspiration.