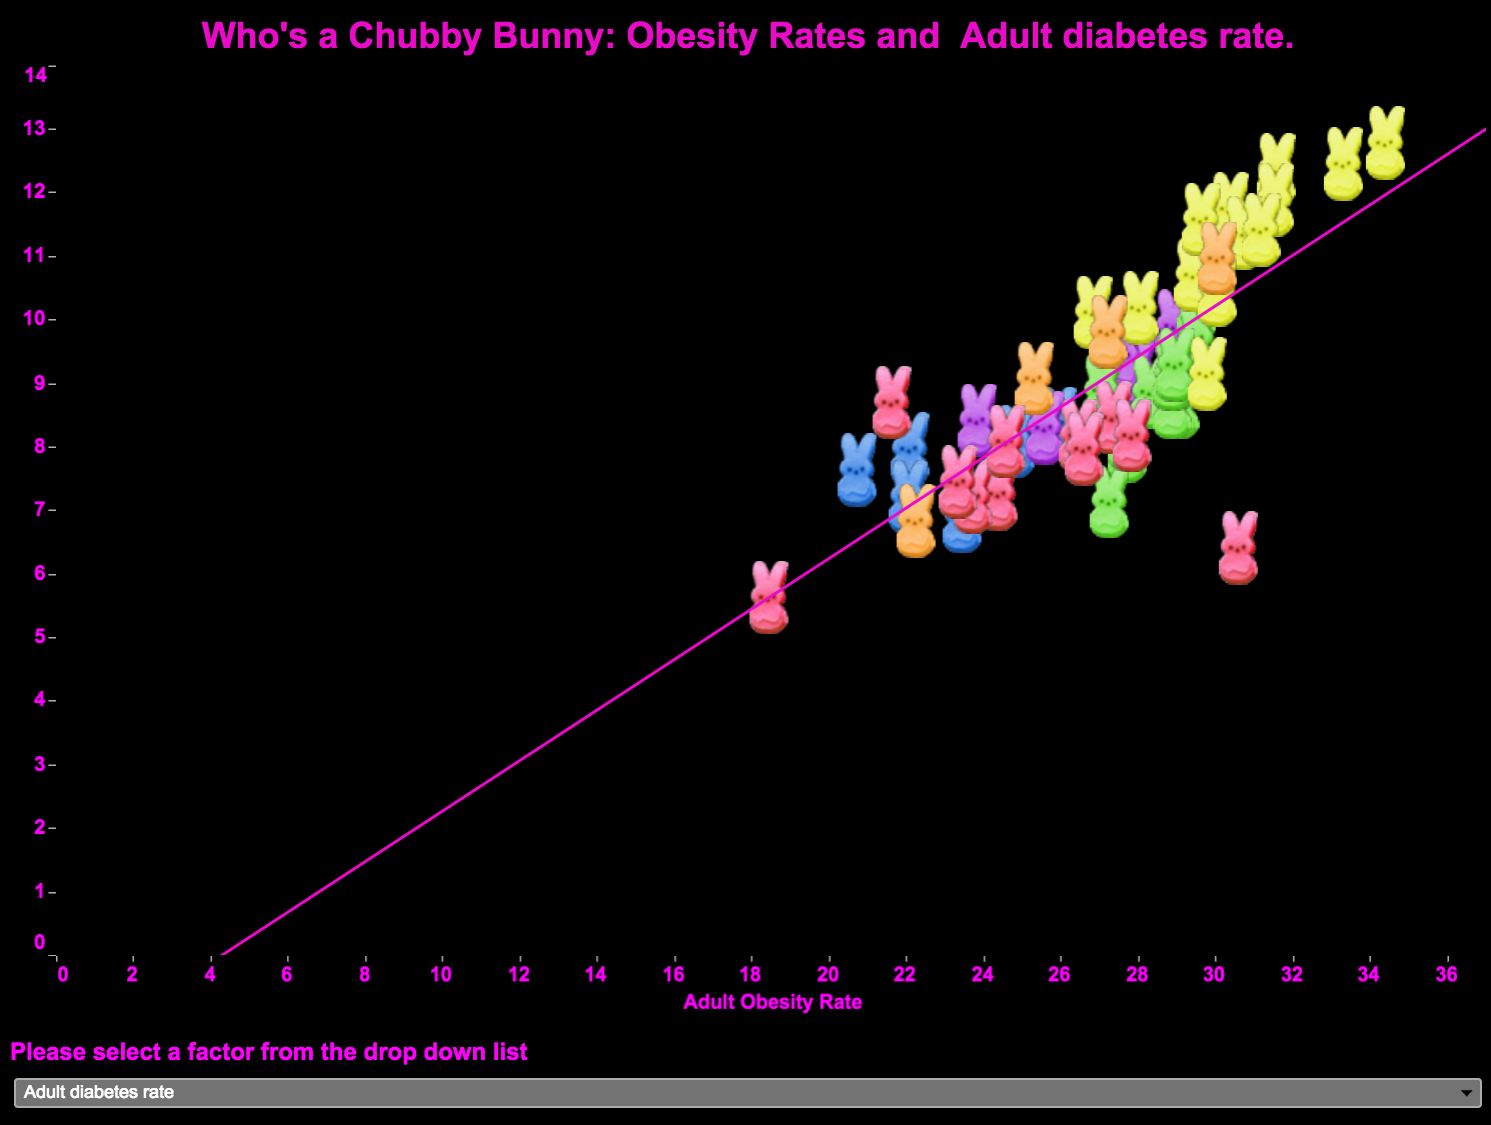
Who's a Chubby Bunny
/Who's a Chubby Bunny is one of the first dashboards that I made using Tableau back in 2009. I was on a plane ride to Scotland and my son who was 5 at the time wanted to know what I did for a living. Using data on factors that could potentially contribute to obesity, I created a correlation chart that allow the user to select a factor and see if there is a relationship. The bunnies are color coded for US region to allow further analysis. The focus was to play with the ability to customize the shape options by using marshmallow peeps and to make my job interesting to a 5 year old.


